The Local
Growth Index
Growth Index
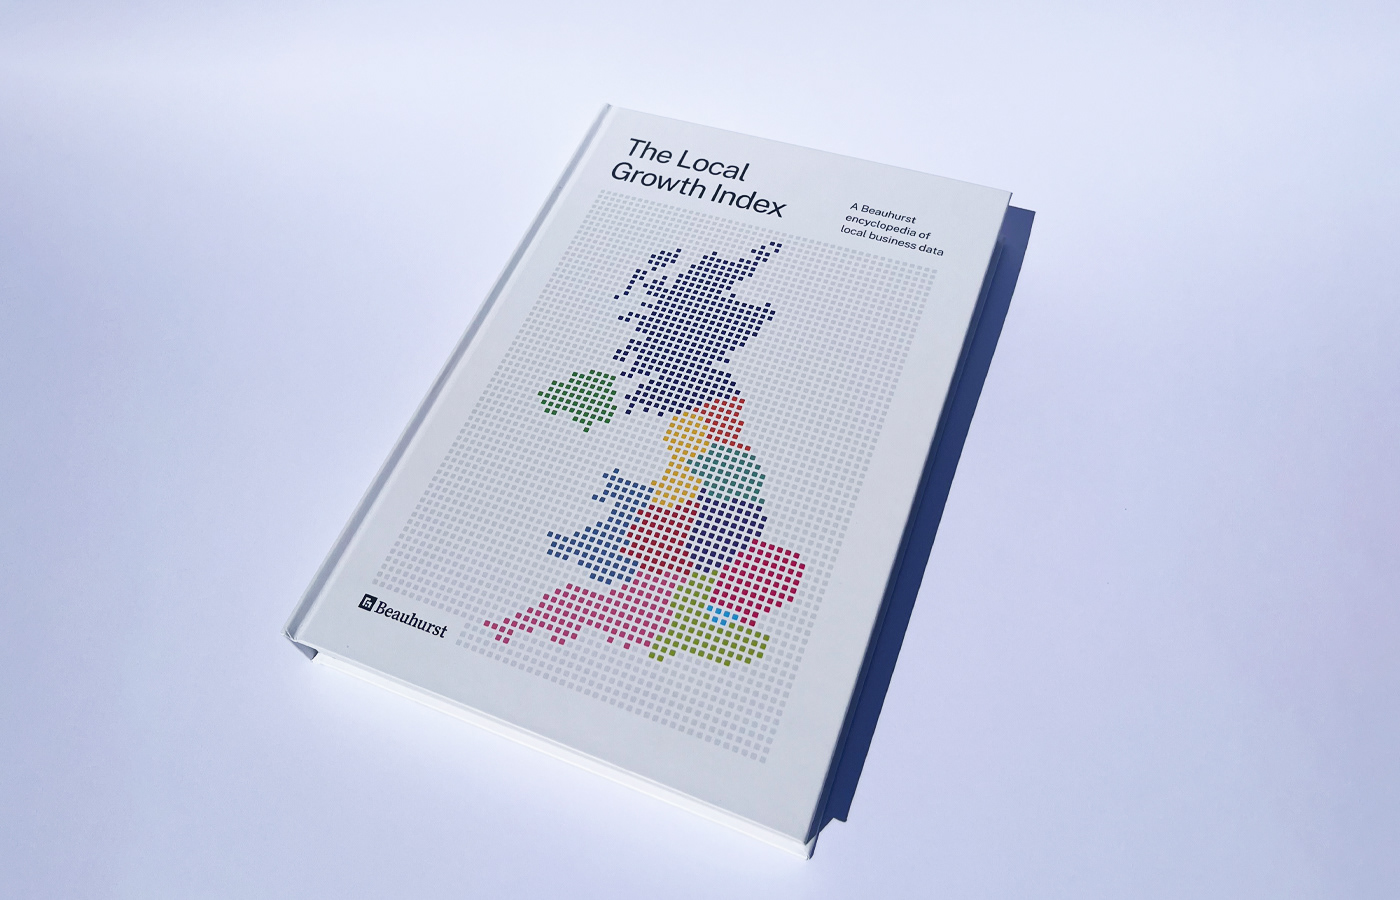
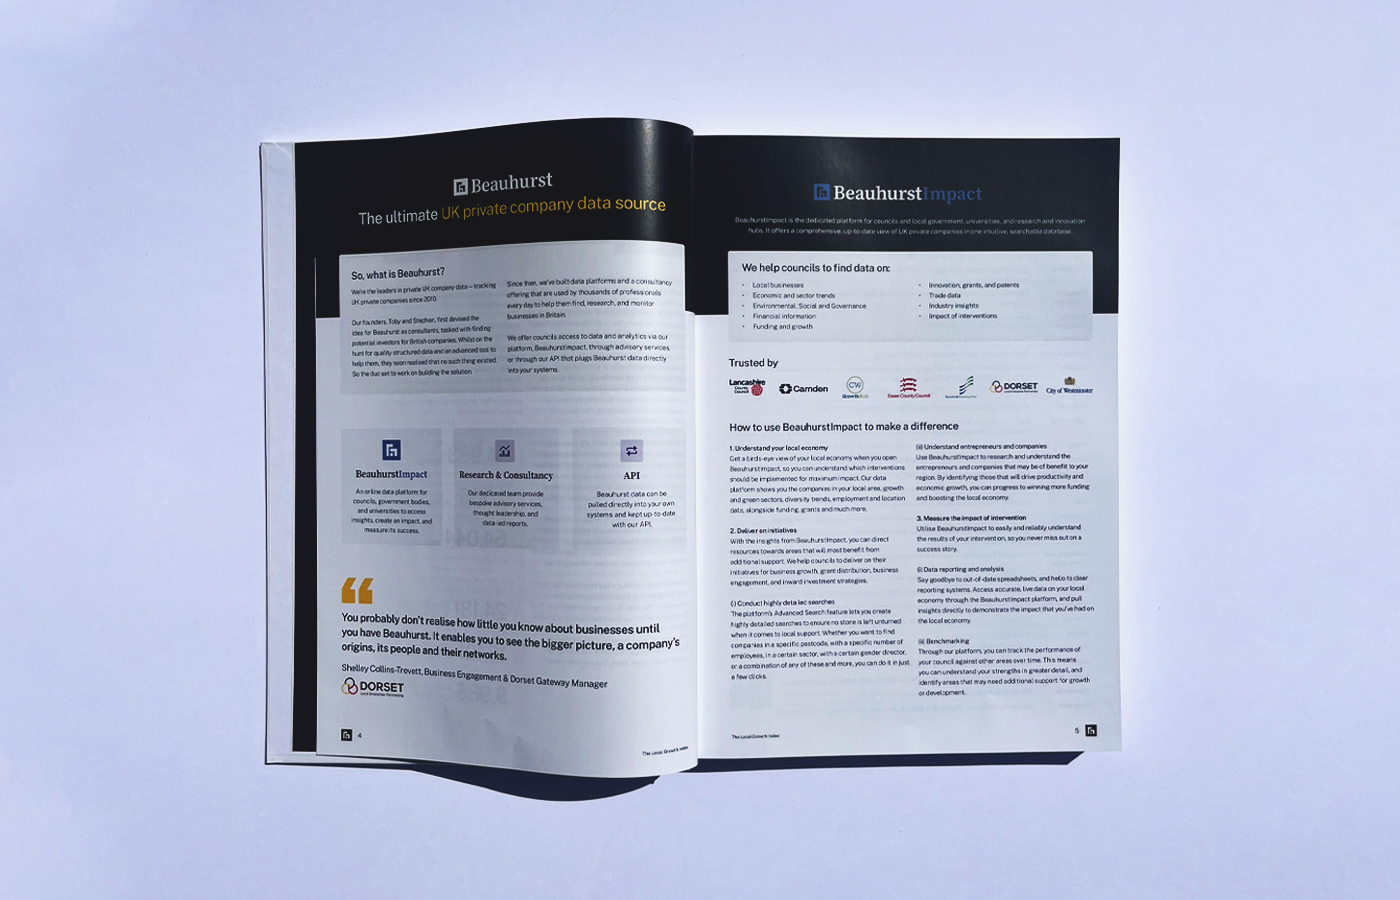
A 432-page data-driven publication designed to demonstrate Beauhurst’s value to UK councils and drive platform subscriptions.

Challenge
Beauhurst needed a clear and engaging way to showcase the depth of data on its platform to potential council clients across the UK. The task involved designing a large-format printed book based on a complex dataset, with a tight turnaround and no room for manual inefficiencies. It was essential to find a way to scale the design process without compromising on clarity or quality.
Beauhurst needed a clear and engaging way to showcase the depth of data on its platform to potential council clients across the UK. The task involved designing a large-format printed book based on a complex dataset, with a tight turnaround and no room for manual inefficiencies. It was essential to find a way to scale the design process without compromising on clarity or quality.


Solution
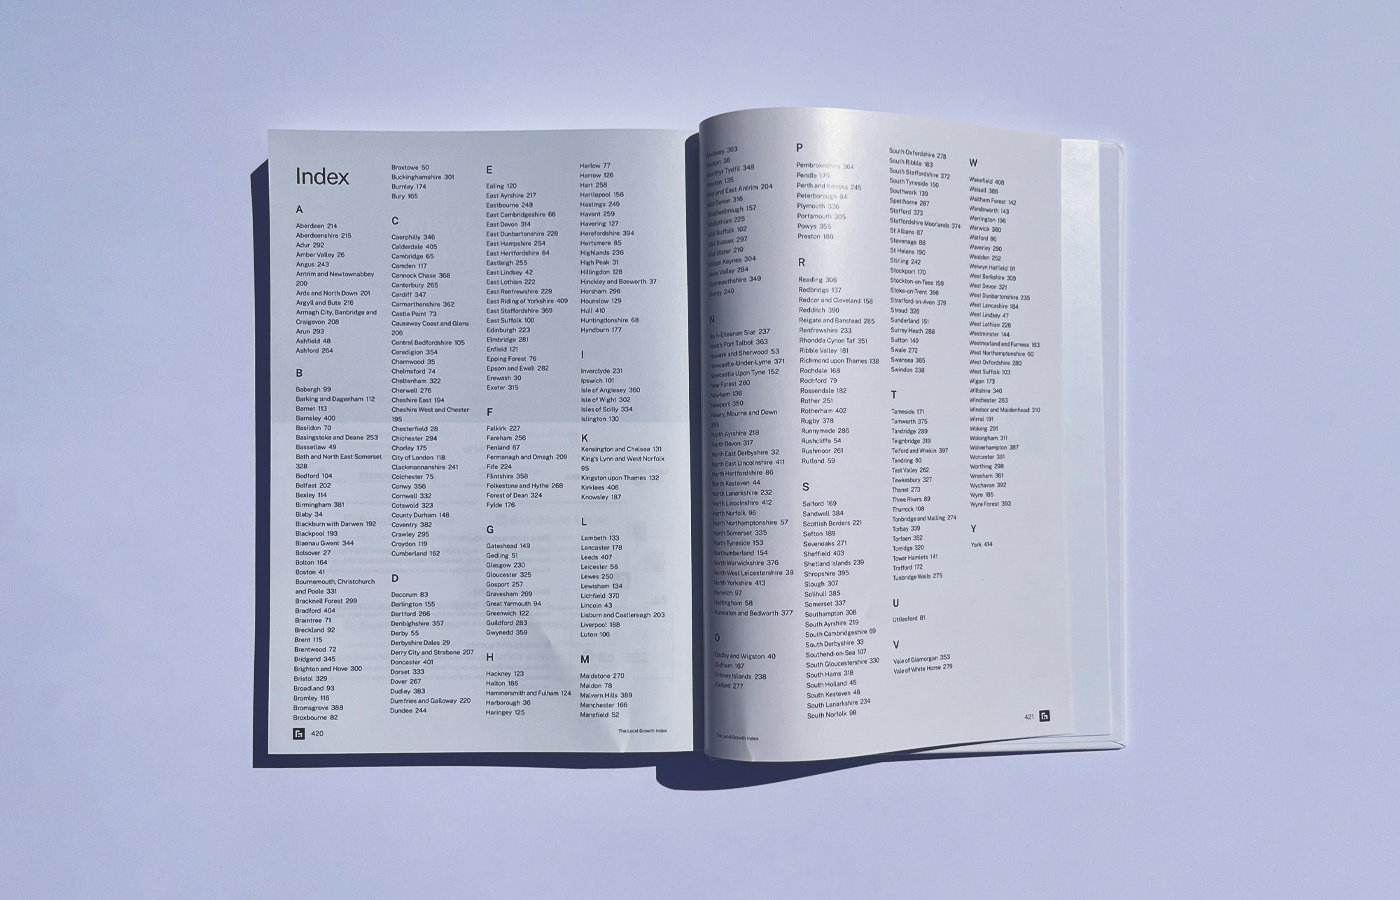
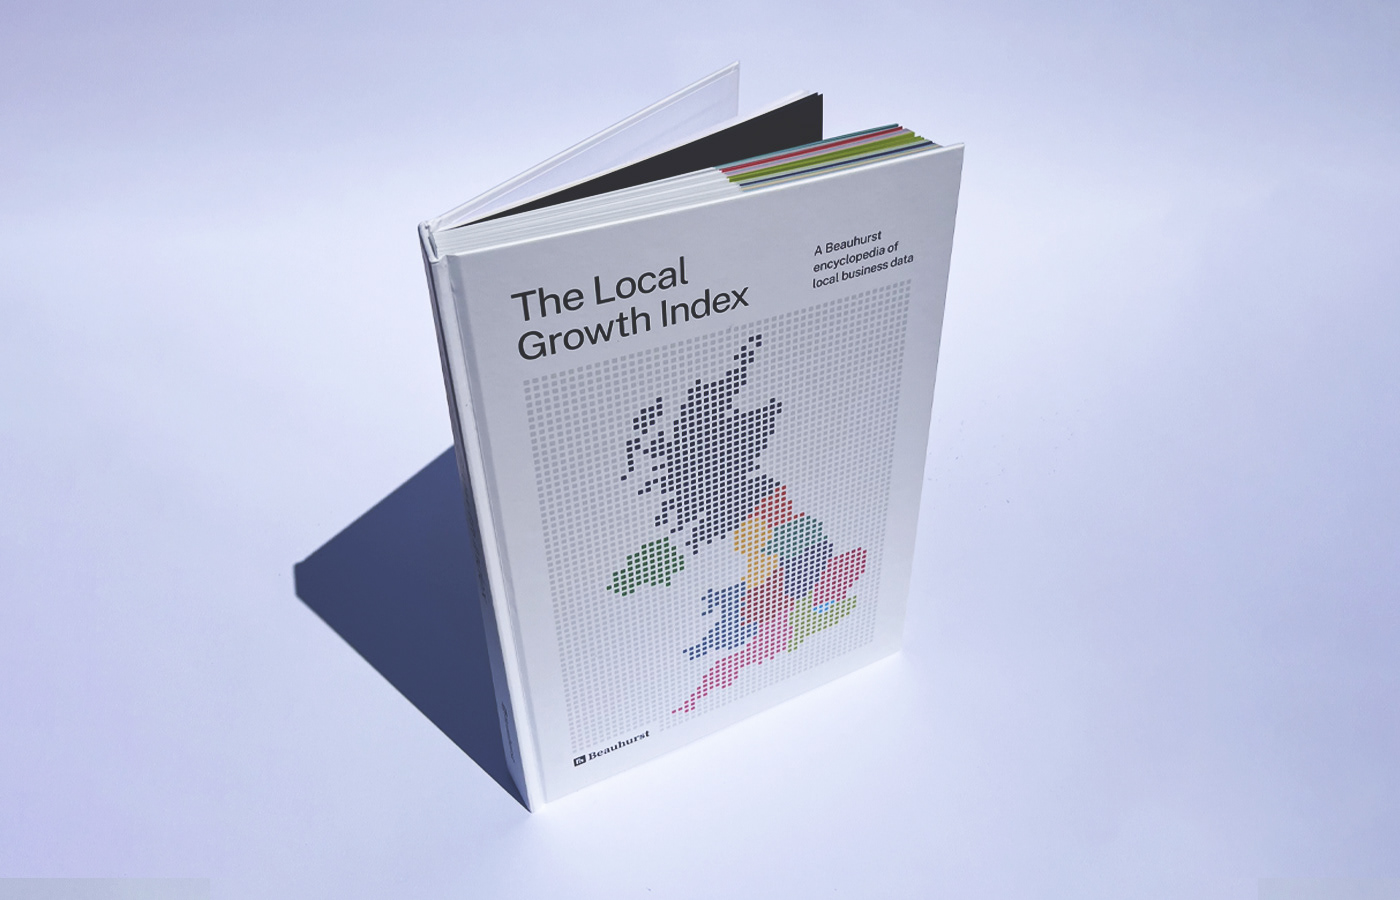
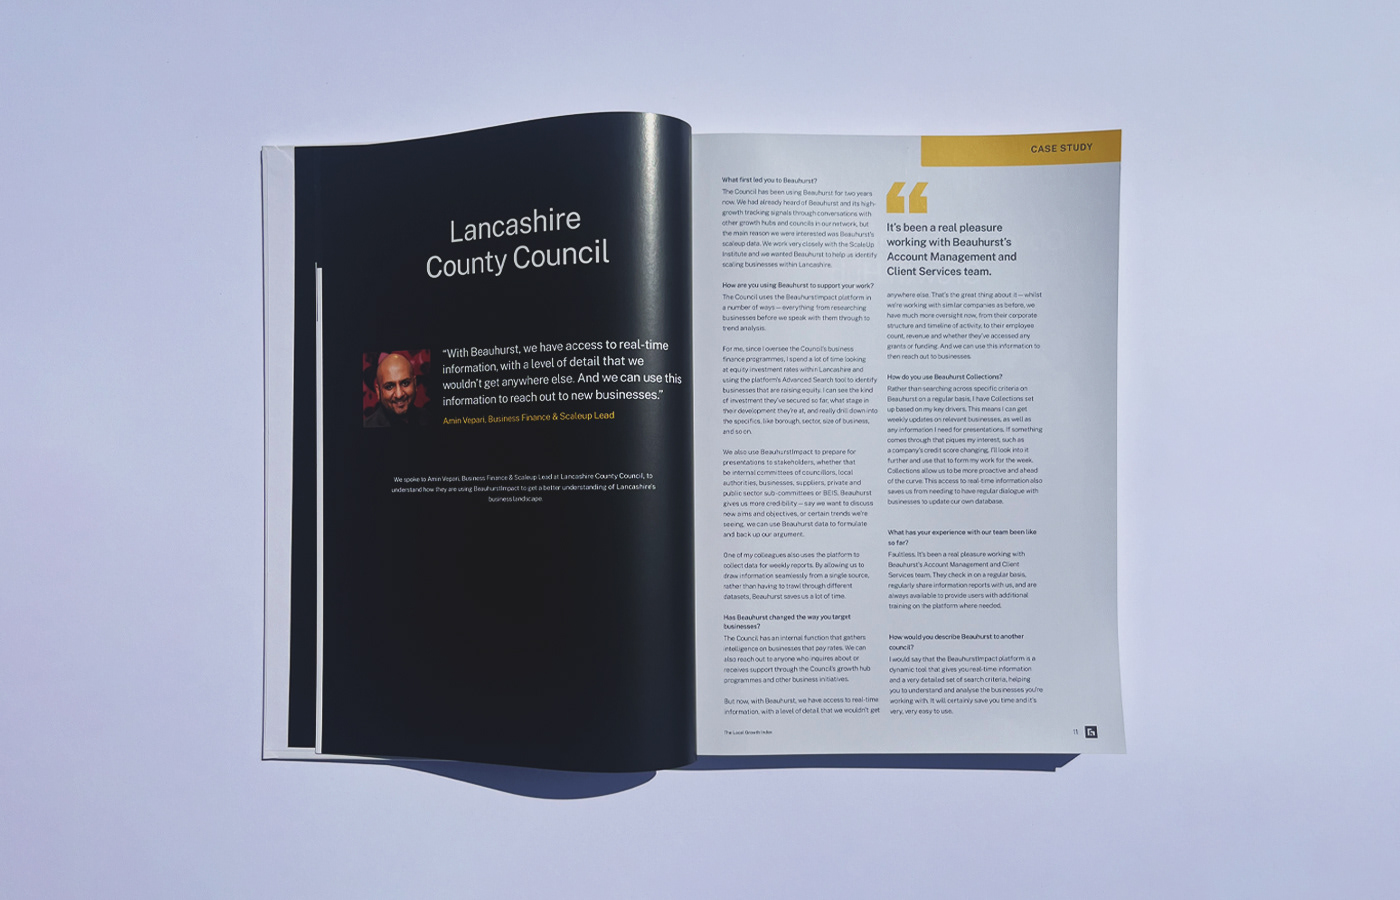
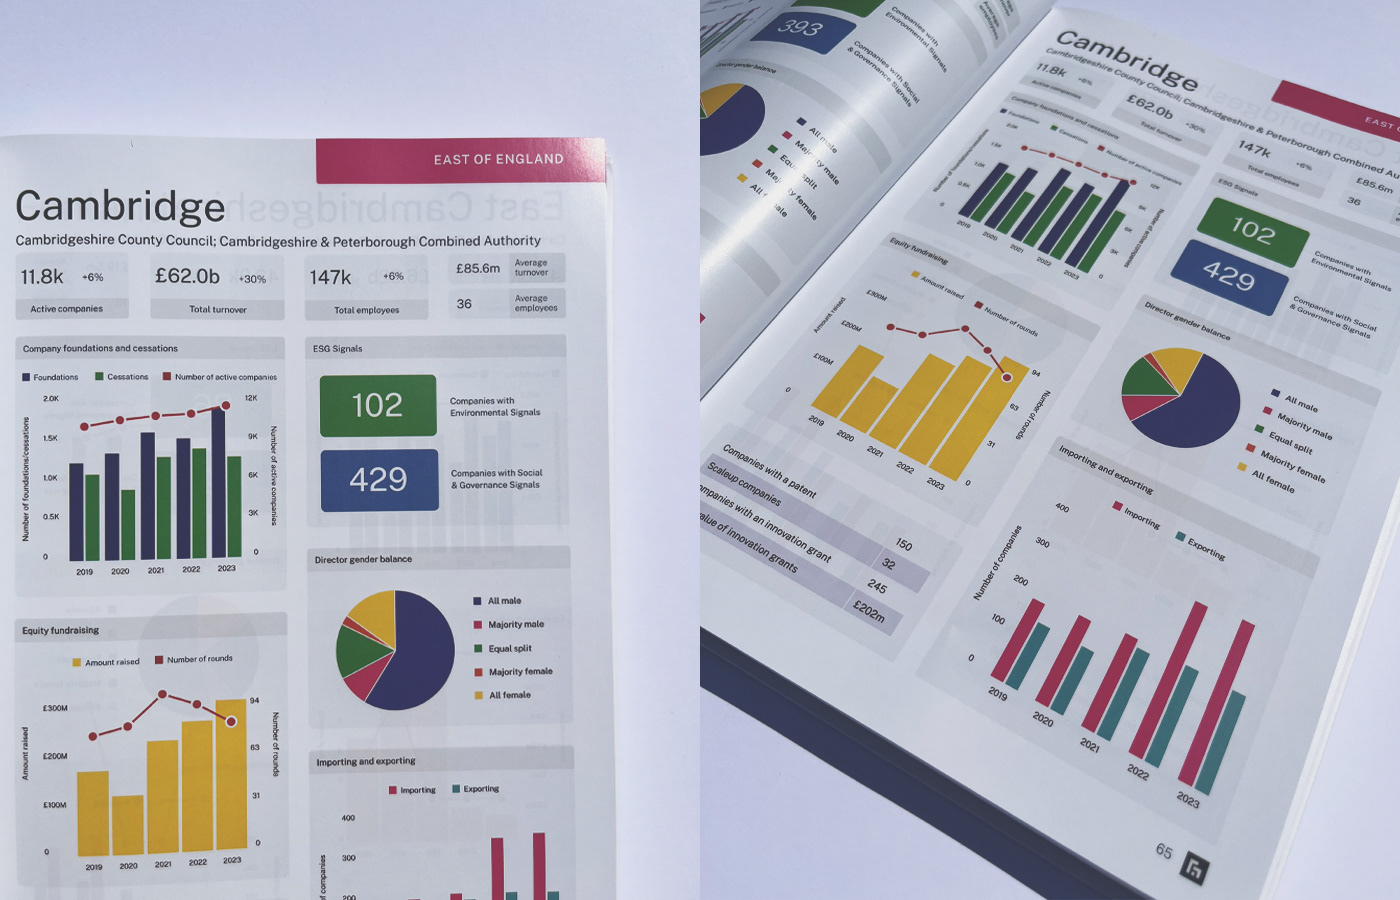
To streamline the process, I used Infogram, a data visualisation tool that allowed me to build a single infographic template and dynamically populate it with data from the Beauhurst platform. This meant each page could be auto-generated with minimal manual design work. I also introduced a colour-coded regional system, applied throughout the book to clearly separate each section. This system allowed readers to easily find their region and navigate to the relevant council data, using consistent colours across maps, tabs and page layouts.
To streamline the process, I used Infogram, a data visualisation tool that allowed me to build a single infographic template and dynamically populate it with data from the Beauhurst platform. This meant each page could be auto-generated with minimal manual design work. I also introduced a colour-coded regional system, applied throughout the book to clearly separate each section. This system allowed readers to easily find their region and navigate to the relevant council data, using consistent colours across maps, tabs and page layouts.

Outcome
The result was a 432-page printed book, designed and delivered in just a few months. It was distributed to councils across the country and successfully drove five new council subscriptions, covering production costs, generating a return, and strengthening Beauhurst’s presence in the public sector.
The result was a 432-page printed book, designed and delivered in just a few months. It was distributed to councils across the country and successfully drove five new council subscriptions, covering production costs, generating a return, and strengthening Beauhurst’s presence in the public sector.